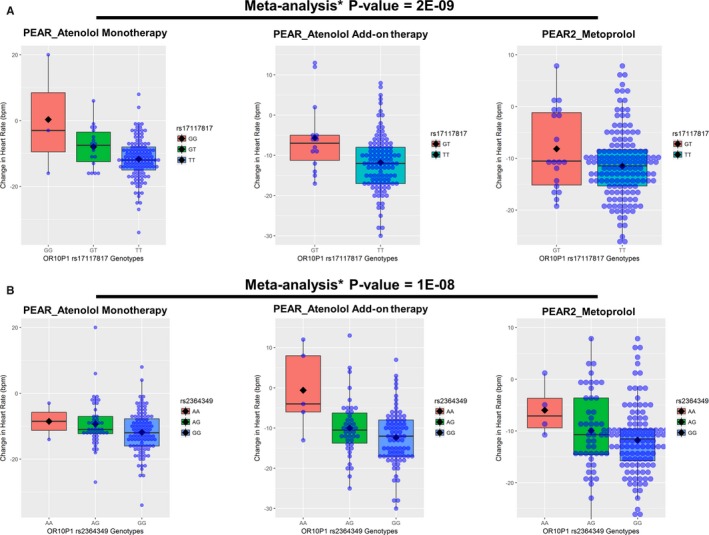
Figure 3.

Effect of rs17117817 and rs2364349 polymorphisms on the β‐blocker HR response in whites within PEAR and PEAR‐2 studies. A, rs17117817. B, rs2364349. The box represents the values from the 25% to 75% percentile. The horizontal line represents the median. The black diamond represents the mean. The vertical line extends from the minimum to the maximum value. Each blue dot represents an individual. HR response was adjusted for age, sex, baseline HR, differences in dose, and principal components 1 and 2. Two‐sided P values represented are for the contrast of adjusted means between different genotype groups. *Meta‐analysis was performed assuming fixed effects and using inverse‐variance weighting. bpm indicates beats per minute; HR, heart rate; OR10P1, olfactory receptor family 10 subfamily p member 1; PEAR, Pharmacogenomic Evaluation of Antihypertensive Responses; SNX9, sorting nexin 9.
