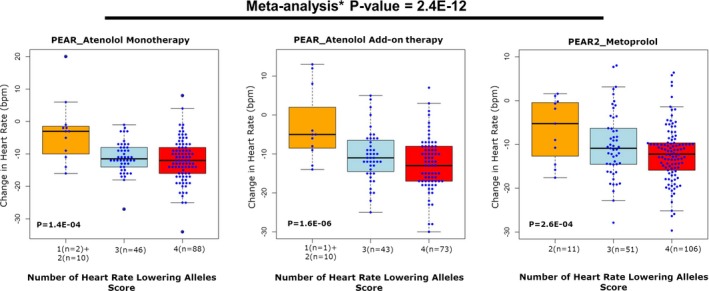
Figure 5.

β‐Blocker's HR response score in PEAR and PEAR‐2. HR responses were adjusted for age, sex, baseline HR, differences in dose, and principal components 1 and 2. Genetic variants were coded as follows: (A) rs17117817 (OR10P1 genetic region) T/T=2, G/T=1, G/G=zero, and (B) rs2364349 (SNX9 genetic region) G/G=2, A/G=1, A/A=zero. The box represents the values from the 25% to 75% percentile. The horizontal line represents the median. The vertical line extends from the minimum to the maximum value. Each blue dot represents an individual. bpm indicates beats per minute HR, heart rate; PEAR, Pharmacogenomic Evaluation of Antihypertensive Responses. *Meta‐analysis was performed between PEAR atenolol monotherapy, PEAR atenolol add‐on therapy, and PEAR‐2 metoprolol groups, assuming fixed effects and using inverse‐variance weighting.
