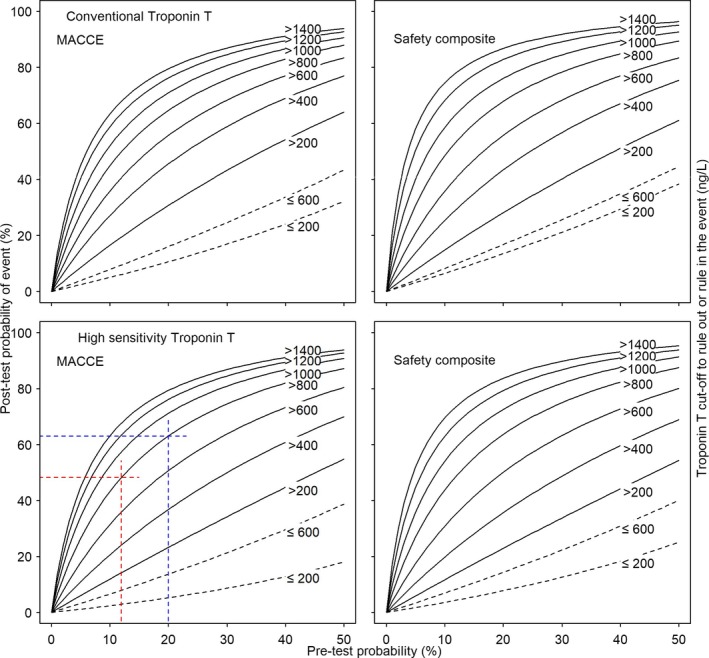
Figure 3.

Nomograms of the relation between pretest and posttest probability of major adverse cardiac or cerebrovascular events (MACCE) or the safety composite, by troponin levels. The curves are based on pretest probabilities and fitted likelihood ratios of cardiac troponin T (cTnT) cutoffs for the risk of MACCE (left panels) and the safety composite (right panels) for conventional cTnT (top panels) and hs‐cTnT (bottom panels). Black dashed lines represent the relation between pretest and posttest probabilities, ruling out future events by cTnT levels equal to or smaller than the cutoff on the basis of negative likelihood ratios; black solid lines, the relation between pretest and posttest probabilities, ruling in future events by cTnT levels larger than the cutoff on the basis of positive likelihood ratios. Red and blue lines relate to reading examples described in the text.
