Figure 1.

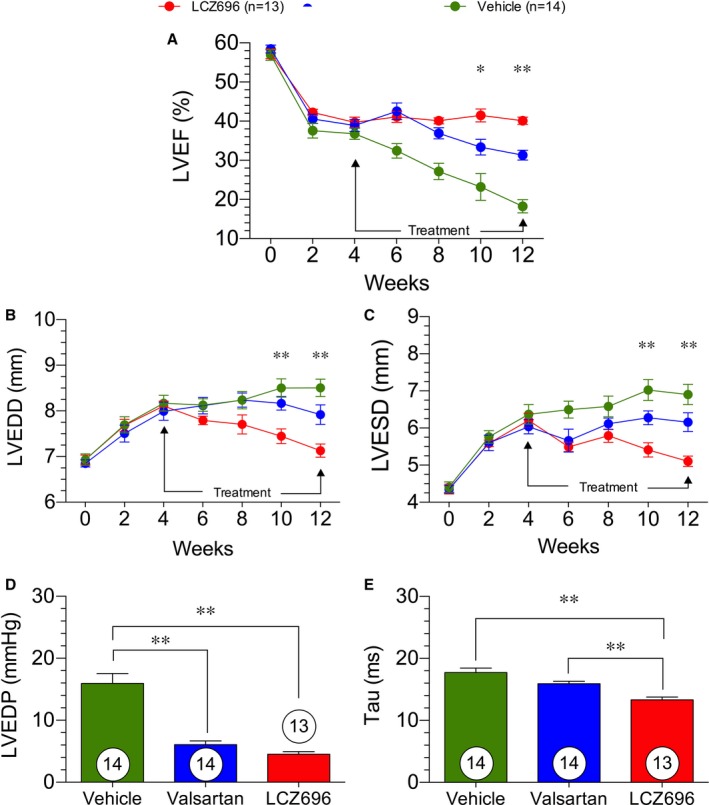
Cardiovascular function and structure in heart failure. Cardiovascular structure and function was measured by 2‐dimensional serial echocardiography at baseline and every 2 weeks after acute myocardial infarction for a period of 12 weeks. Left ventricular ejection fraction (LVEF; %; A), left ventricular end‐diastolic diameter (LVEDD; mm; B), left ventricular end‐systolic diameter (LVESD; mm; C), left ventricular end‐diastolic pressure (LVEDP) at 12 weeks (D), and τ at 12 weeks (E). The figure legend indicates treatment groups and number of animals in each group. *P<0.05, **P<0.01 for the difference between valsartan and sacubitril/valsartan (also known as LCZ696).
