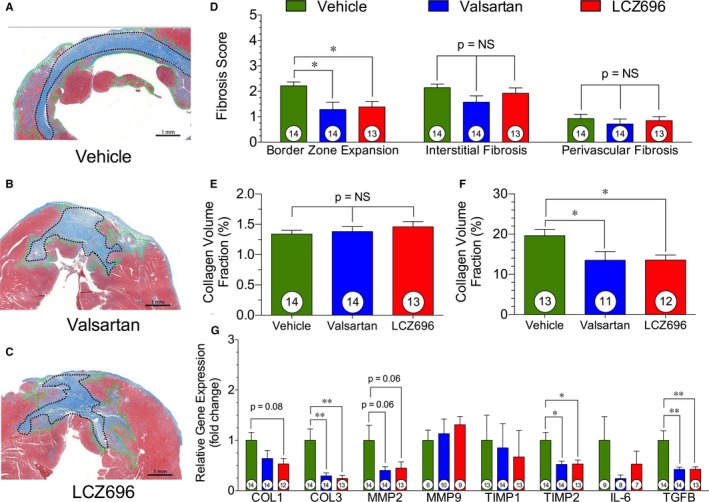
Figure 3.

Myocardial fibrosis. Myocardial fibrosis at 12 weeks after acute myocardial infarction. A, Representative photomicrographs of infarct border zone expansion, with infarct scar outlined in black and border zone outlined in green in a vehicle heart. B, Representative image of infarct and infarct border zone expansion, with infarct scar outlined in black and border zone outlined in green in a valsartan‐treated heart. C, Representative image of sacubitril/valsartan (also known as LCZ696) heart infarct. Infarct scar is outlined in black, and the infarct border zone is outlined in green. D, Myocardial fibrosis scoring of infarct border zone expansion, interstitial fibrosis, and perivascular fibrosis. E, Quantification of collagen content in the infarct border zone. F, Quantification of collagen content in the myocardial interstitum. G, Expression of fibrosis genes in the myocardium immediately adjacent to the scar. Animal numbers are shown in white circles within their respective columns. NS indicates not significant. *P<0.05, **P<0.01.
