
Figure 3.
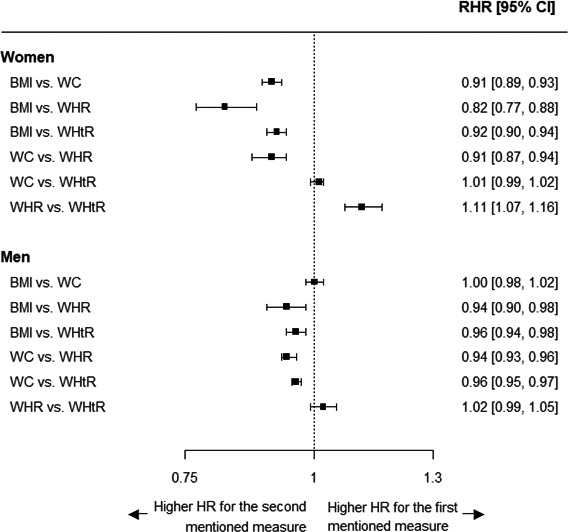
Ratio of women‐to‐men hazard ratios for incident MI per 1–standard deviation higher value for each comparison of anthropometric measures, by sex. Analyses are adjusted for age, Townsend deprivation index, and smoking status. The first 2 years of follow‐up were excluded. The standard deviation is taken from the sex‐combined baseline data. BMI indicates body mass index; CI, confidence interval; HR, hazard ratio; MI, myocardial infarction; RHR, ratio of hazard ratios; WC, waist circumference; WHR, waist‐to‐hip ratio; WHtR, waist‐to‐height ratio.