Figure 1.

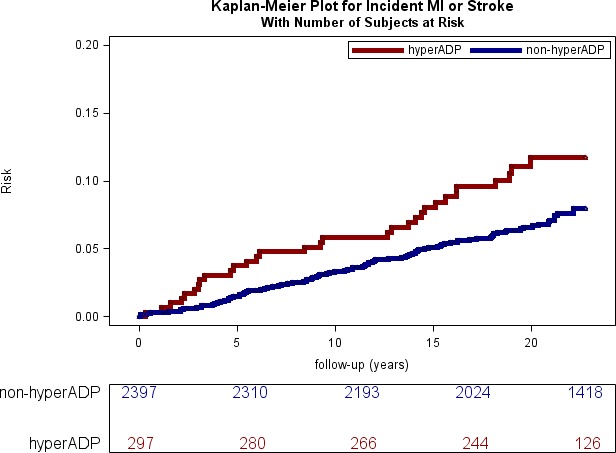
Kaplan‐Meier curve for incident nonfatal myocardial infarction (MI) or stroke events in hyper‐ADP platelet aggregators vs non–hyper‐ADP aggregators at baseline. The numbers at risk are shown in 5‐year increments from baseline.

Kaplan‐Meier curve for incident nonfatal myocardial infarction (MI) or stroke events in hyper‐ADP platelet aggregators vs non–hyper‐ADP aggregators at baseline. The numbers at risk are shown in 5‐year increments from baseline.