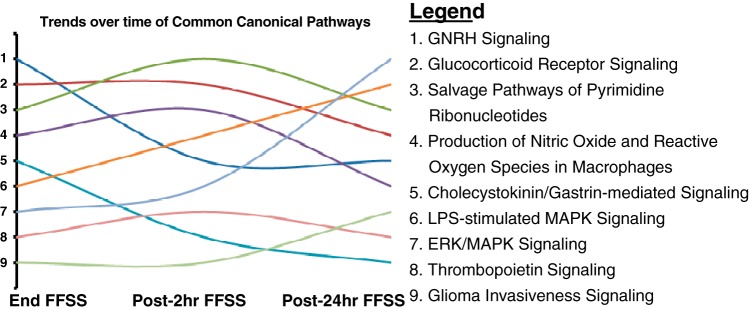
Fig. 5.
Ingenuity Pathway Analysis outlined as trends for the nine canonical pathways that were altered in all experimental groups based on differential gene expression (P < 0.01) in each experimental group compared with control (End-FFSS vs. Control, Post-2 h FFSS vs. Control, and Post-24 h FFSS vs. Control). The rank order distribution shown in Table 4 suggests 1) an upward trend of MAPK/ERK signaling and LPS-stimulated MAPK signaling with time and 2) a downward trend of gonadotropin-releasing hormone (GNRH) signaling and cholecystokinin/gastrin-mediated signaling.

