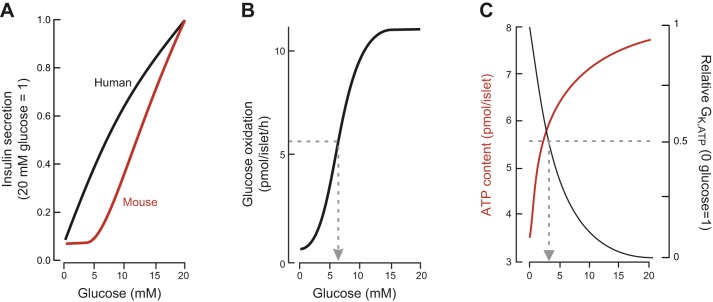
FIGURE 2.
A: relationship between glucose concentration and insulin secretion in static incubations of isolated mouse (red) and human (black). Secretory responses have been normalized to secretion at 20 mM glucose. [Modified from Walker et al. (717).] B: relationship between glucose concentration and oxidative metabolism of the sugar (measured as 14CO2 production radiolabeled glucose) in isolated mouse islets (75% β-cells). Glucose oxidation is half-maximal at ~6 mM glucose (arrow). [Modified from Ashcroft et al. (33).] C: relationship between glucose concentration and ATP content (red) and β-cell whole-cell KATP channel conductance (GK,ATP: normalized to conductance at 0 mM glucose) in isolated mouse islets. Effects of glucose on both parameters are half-maximal at ~3 mM glucose (arrowed). [Modified from Ashcroft et al. (34) and Zhang et al. (762).]

