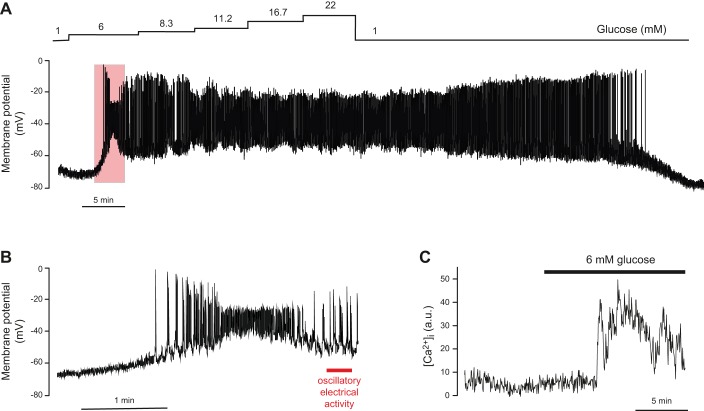
FIGURE 6.
A: glucose-induced electrical activity in a β-cell in an intact human pancreatic islet in response to increasing glucose concentrations, as indicated by the staircase above the membrane potential recording. Note that it takes >40 min for β-cell to repolarize following exposure to glucose. B: response to 6 mM glucose (indicated by red rectangle in A) shown on an expanded time base. The action potentials undergo complex time-dependent changes in amplitude and peak voltage (see also FIGURE 13C). At 6 mM glucose, bursts of 3 or 4 action potentials are sometimes observed (red horizontal line under recording: see FIGURE 13B). Recordings in A and B were performed by Dr. E. Rebelato, Oxford. C: changes in [Ca2+]i in response to increasing glucose from 1 to 6 mM in a cell (presumably a β-cell) in an intact human islet. [Modified from Rorsman et al. (569).]

