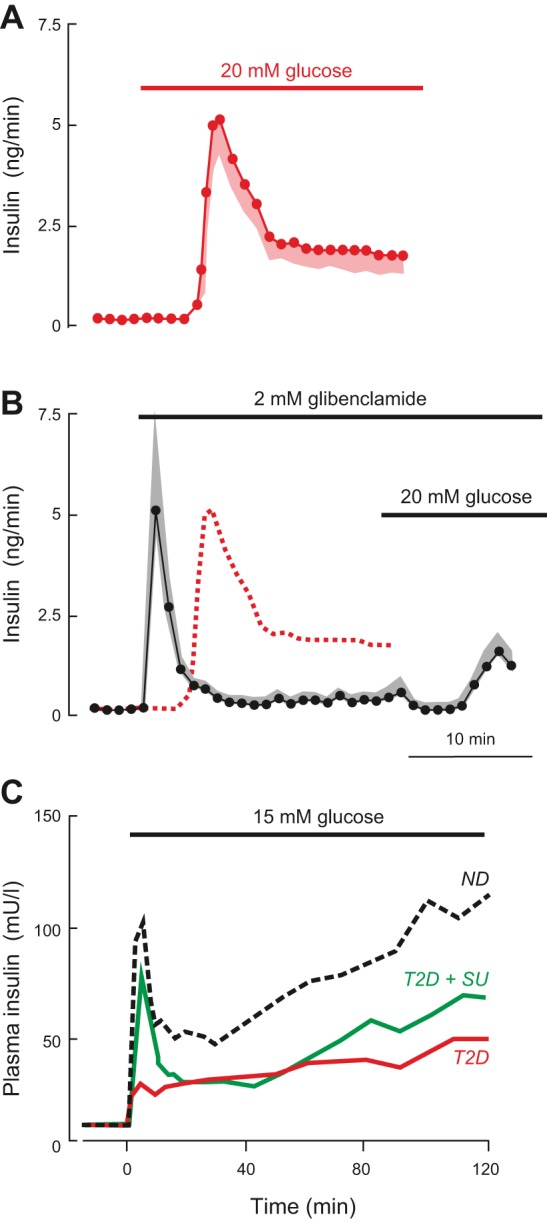
FIGURE 14.

A: insulin secretion measured in the perfused mouse pancreas preparation when glucose was elevated from 1 to 20 mM (as indicated by horizontal bar). B: same as in A but secretion was elicited by 2 µM glibenclamide (a KATP channel blocker) (horizontal bar). Glucose was subsequently elevated to 20 mM glucose (horizontal bar) in the continued presence of glibenclamide. The dotted line illustrates the insulin response to glucose shown in A. In A and B, data points indicate mean values and the shaded areas the SE (shaded areas). Data provided by N. Rorsman, Oxford. C: geometric mean of plasma insulin concentrations during a hyperglycemic clamp at 15 mM glucose (horizontal bar) in nondiabetic subjects (ND) and in patients with type 2 diabetes mellitus treated by diet (T2D) or the sulfonylurea gliclizide (T2D + SU). [Modified from Hosker et al. (292).]
