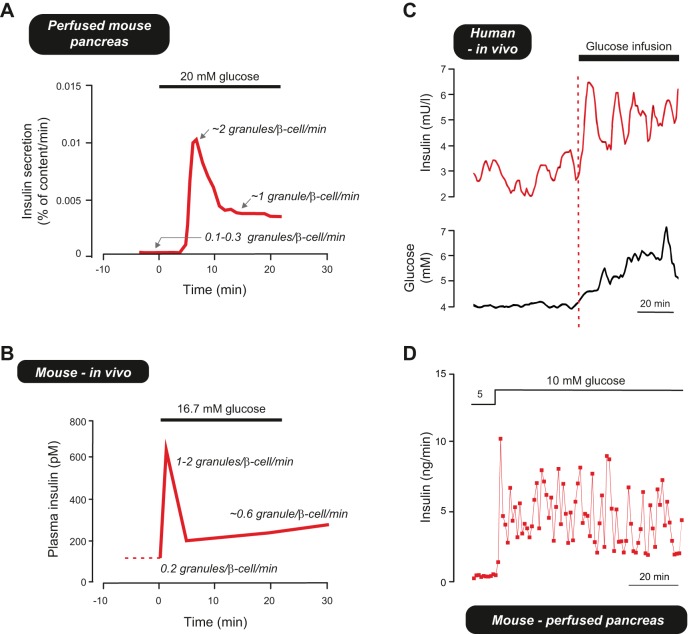
FIGURE 15.
A: estimated rates of insulin secretion in the perfused mouse pancreas based on the experiment shown in FIGURE 14A and a total pancreatic insulin content of 50 μg [based on 0.008 g pancreas/g body weight, 0.25 μg insulin/g pancreas and a body weight of ~25 g (69)]. B: rates of insulin secretion in vivo estimated by solving Equation 1 using plasma insulin levels reported by (275) and a granule insulin content of 1.6 amol (294)(equivalent to ~8 fg of insulin). C: pulsatile insulin secretion in humans. The red and black traces show a 3-min moving average of the plasma insulin and glucose concentrations of a normal subject upon glucose infusion. Note that increasing glucose by ~0.5 mM more than doubles plasma insulin levels during the first oscillation. [Data modified from Lang et al. (363).] D: pulsatile insulin secretion measured using the perfused mouse pancreas preparation and a perfusion rate of ~0.3 ml/min. Data provided by N. Rorsman, Oxford.

