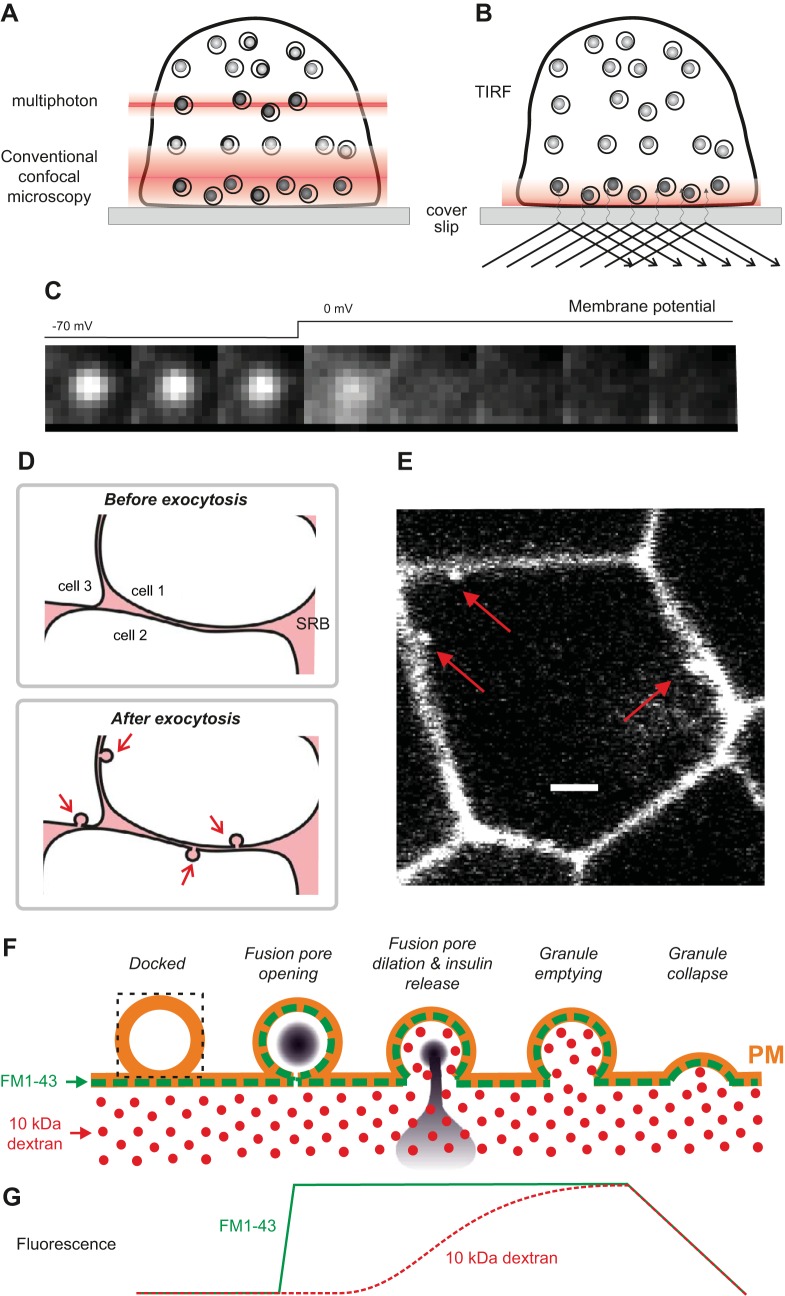
FIGURE 18.
A: imaging of granules in a β-cell using conventional and two-photon confocal microscopy. Note that the multiphoton microscopy allows imaging within a thinner slice of the cell (because two photons must simultaneously excite the fluorophore, which is unlikely to occur outside the focal plane). Insulin or other proteins of interest are visualized by expression of GFP-tagged proteins. B: evanescent wave (TIRF) microscopy. Illumination of the specimen is restricted to a layer above the coverslip, only a few hundred nanometers thick, thus facilitating the study of events taking place in the immediate vicinity of the plasma membrane. C: TIRF imaging of granule exocytosis. Images were captured at 20 Hz (50-ms intervals) in a voltage-clamped β-cell held at −70 mV and depolarized to 0 mV as indicated above the images. Granules close to the membrane are seen as bright spots at −70 mV. Exocytosis on depolarization to 0 mV is seen as a brief flash of light followed by the rapid dissipation of fluorescence as the tagged protein diffuses away from the release site. D: imaging of exocytosis using a fluorescent fluid phase marker (e.g., sulforhodamine; abbreviated SRB). SRB occupies the thin space between adjacent cells (top). Exocytosis results in the fusion of granules with the plasma membrane, enabling SRB to enter the granule lumen, producing fluorescent invaginations that can be visualized by multiphoton confocal imaging (bottom). E: three examples (red arrows) of granules labeled with SRB that have undergone exocytosis in response to high glucose (20 mM). Scale bar: 3 μm. [From Hoppa et al. (289).] F: monitoring fusion pore expansion and exocytosis by using extracellular fluid space markers (e.g., 10 kDa Alexa-conjugated dextran; red dots) with the membrane label FM1–43 (green). Upon membrane fusion, FM1–43 (which has prelabeled the outer leaflet of the plasma membrane; dashed green line) labels the granule membrane via lateral diffusion. Entry of fluorescent dextran will only occur once the fusion pore has expanded sufficiently to accommodate dextran. G: schematic of parallel recordings of FM1–43 fluorescence (green trace) and dextran fluorescence (red trace). Note that FM1–43, measured by two-photon confocal microscopy within a rectangular square (superimposed on the leftmost granule), increases promptly upon exocytosis. Uptake of dextran is delayed relative to FM1–43 uptake and the fluorescence signal (measured within the rectangle) for both FM1–43 and dextran decrease when the granule membrane collapses into the plasma membrane (see Ref. 664).

