FIGURE 22.
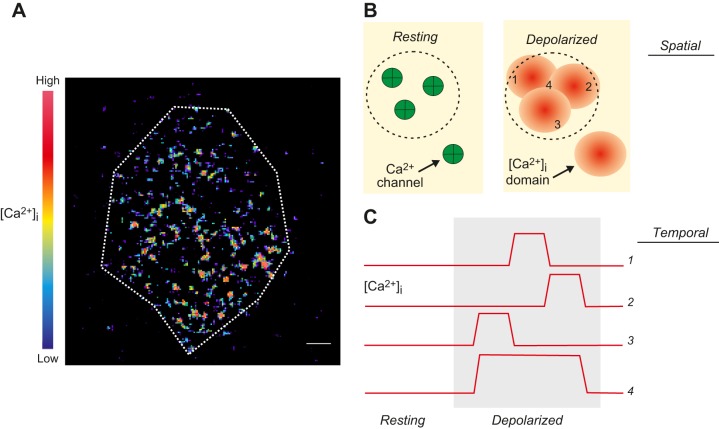
A: TIRF imaging of near-membrane [Ca2+]i increases in a single voltage-clamped β-cell stimulated by a single 50-ms depolarization from −70 to 0 mV. The cell was infused with EGTA (10 mM) to restrict intracellular diffusion of Ca2+. Changes in [Ca2+]i are displayed in pseudocolors with black/blue and yellow/red corresponding to very low and high concentrations, respectively. Scale bar: 2 μm. Note that Ca2+ entry is not uniform but restricted to many ‟hotspotsˮ (red). [Modified from Hoppa et al. (288).] B: schematic showing how spatial [Ca2+]i domains overlap. Resting: the membrane contains four Ca2+ channels (green). Three of these channels sit beneath a secretory granule (the outline of which is indicated by dashed circle). Depolarization leads to localized Ca2+ entry and [Ca2+]i increases within spatially restricted domains (red). If the Ca2+ channels sit close to each other, these domains overlap. C: spatiotemporal domain overlap. Changes in [Ca2+]i at four different locations, as indicated in B. During the depolarization (gray area), the individual Ca2+ channels open and close stochastically and [Ca2+]i (traces 1–3) echoes Ca2+ channel activity. Individually, the [Ca2+]i are too brief to evoke exocytosis, but a sufficiently long elevation is generated by spatiotemporal domain overlap (location/trace 4).

