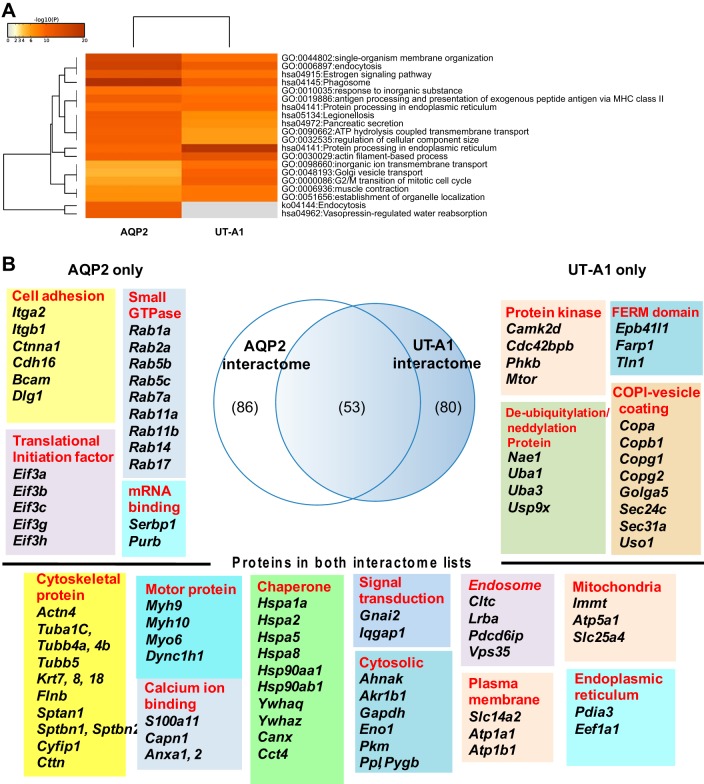
Fig. 9.
Comparisons between UT-A1 and AQP2 interactomes. A: pathway and process enrichment analysis was done in Metascape using “GO Biological Processes” and “KEGG Pathway” annotation terms with P value cutoff at 0.01. B: a Venn diagram depicts numbers of interacting proteins that selectively interact with AQP2 only, or UT-A1 only, or both. All 53 proteins that were found in both interactome lists and serve as housekeeping interactions are listed (bottom). Top left: representative groups of proteins selectively interacted with AQP2. Top right: representative groups of proteins selectively interacted with UT-A1. A complete list of these proteins is given in Table 1.

