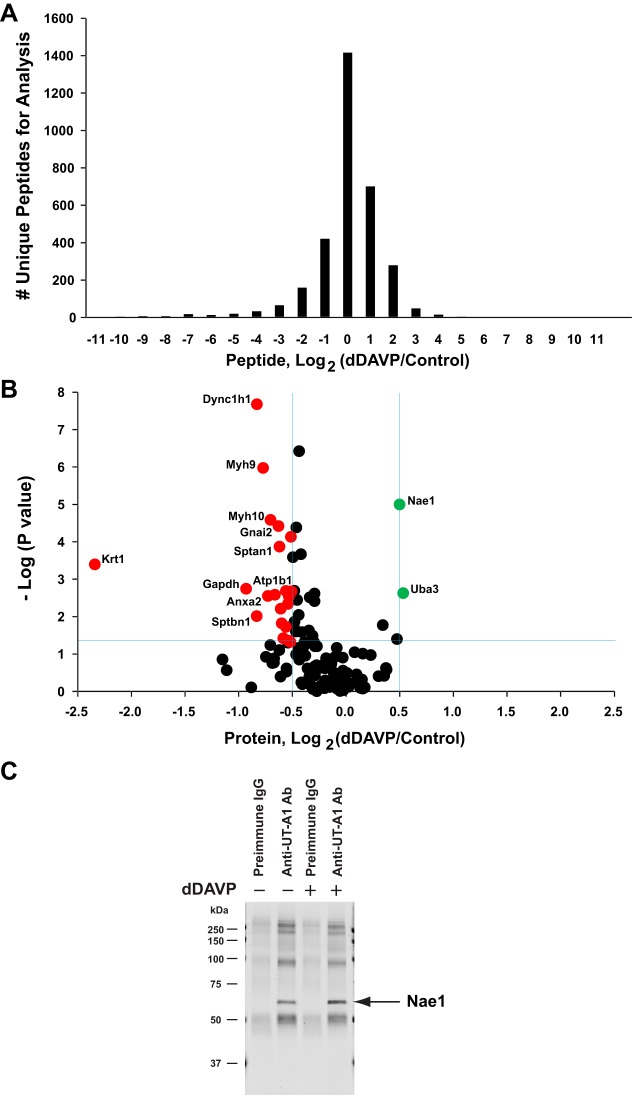
Fig. 11.
Proteins with significant changes in binding to UT-A1 following dDAVP treatment. A: a histogram of the distribution of all peptide ratios, log2(dDAVP/control), for protein analysis. B: a volcano plot analysis for detecting significantly changed proteins. The horizontal blue line demarcates points with P < 0.05. The vertical blue lines indicate values for which the absolute median value of log2(dDAVP/control) was >0.49, determined as 2 times of standard error of log2(control/control). The points that meet both criteria are indicated in green (increased binding) or red (decreased binding). A complete list of these proteins is given in Table 2. C: a representative Nae1 immunoblot from co-IP experiments demonstrates protein-protein interaction between Nae1 and UT-A1. IMCD suspensions treated with dDAVP or vehicle were in situ cross-linked with BSOCOES, solubilized by RIPA, and immunoprecipitated with UT-A1 antibody or preimmune IgG. Nae1 antibody (no. 14321, Cell Signaling) was used at 1:500 dilution. Nae1 at expected molecular mass of 60 kDa was seen in UT-A1 IP samples only (both control and dDAVP-treated) (n = 2). The remaining bands are due to residual IgG.

