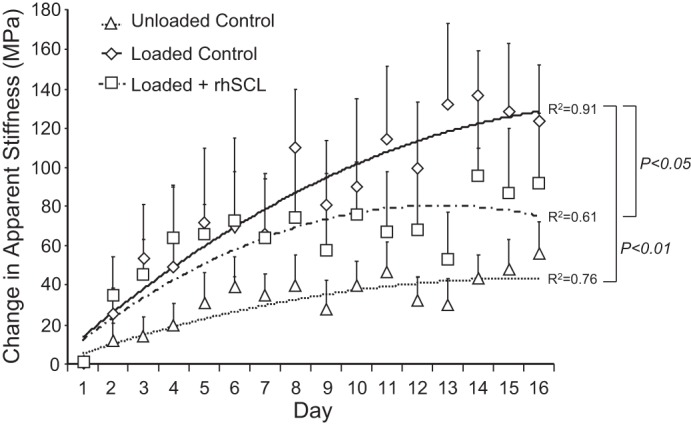
Fig. 3.

Effects of sclerostin on apparent stiffness. The bone cores were divided into 3 groups: unloaded controls, loaded controls, and loaded + rhSCL (50 ng/ml). The loading procedure was 300 cycles/day of 2,000 microstrain applied at a frequency of 1 Hz for 3 wk. The apparent stiffness of each bone sample was determined daily immediately before the load was applied as described in materials and methods. Data are means ± SE of 8 samples per group, all obtained from the same bovine sternum. Similar data were obtained from 3 independent experiments. The regression coefficients (R2) for each group and significant difference between the groups are indicated.
