Figure 4.
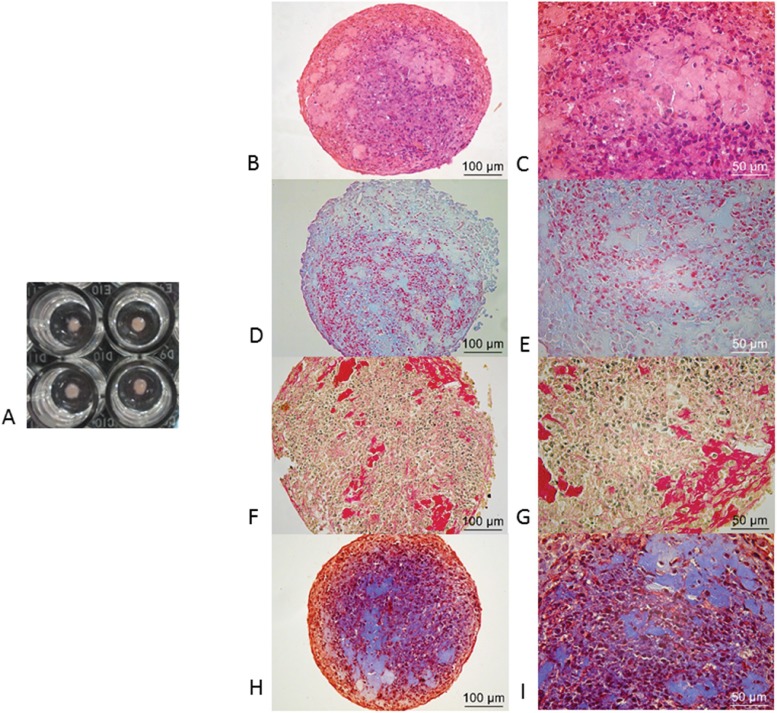
Histological analysis: A) Macroscopic aspect of micromasses after 21 days in TGF-β3-stimulated culture; B and C) The production of cartilage matrix is shown in pinkish and bluish staining (high amount of proteoglycans), and cell nuclei are shown in blue by HE; D and E) GAGs are shown in light blue by AB, and collagen production is shown in blue staining that permeated all the sections in red by MT; the cells contained black nuclei; F and G) In PR-stained sections, collagen appears pale yellow but becomes red when collagen fibers aggregate; H and I) In MT-stained sections, collagen production appears in blue staining that permeated all the sections in red; the cells contained black nuclei.

