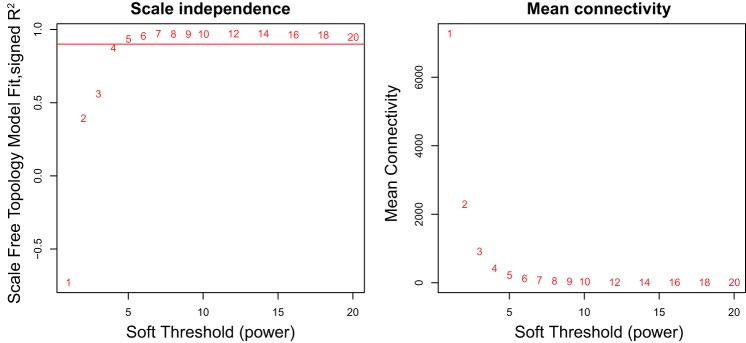
Fig. 5.
Determining soft thresholding parameter for scale-free network in BAT expression. These 2 graphics are used to determine the appropriate soft thresholding parameter to use with weighted gene coexpression network analysis (WGCNA) to ensure that the relationships between genes are described using a scale-free network. On the left is the R2 value that ranges from 0 to 1 and quantifies how well the data resemble a scale-free network when different parameters (x-axis) are chosen. The red horizontal line represents an R2 value of 0.90, the minimum value recommended. The graph on the right depicts the mean gene connectivity for different soft thresholding parameters. In a scale-free network, most genes have few connections. It is recommended that a soft thresholding parameter is chosen when the mean connectivity is small and relatively stable. A soft thresholding parameter of 7 was chosen for this data set.

