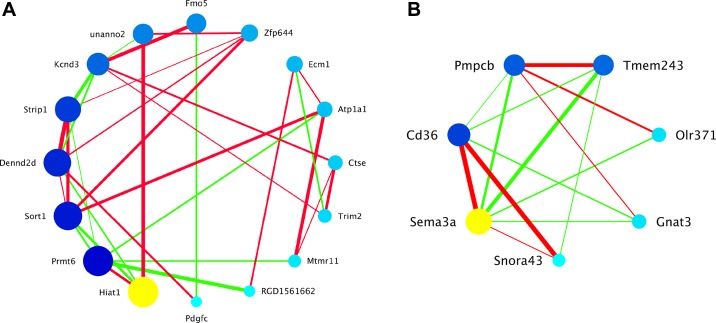
Fig. 6.
Candidate coexpression modules associated with metabolic phenotypes from brown adipose tissue (BAT). Genes within the candidate coexpression network are represented as circles (nodes) within the graphic. Circles are colored, ordered, and sized by intramodular connectivity calculated from partial correlation coefficients that have been adjusted for the module eigengene QTL. The yellow circle is the hub gene (i.e., most connected). Larger, darker nodes are more connected than smaller, lighter nodes. Edges indicate pair-wise correlations between connected genes. Thicker edges indicate correlations with higher magnitude than thinner edges (thickness is related to rank order but does not represent numerical values). Green edges are representative of negative correlations, and red edges are representative of positive correlations. Only pairwise partial correlation coefficients >0.3 or <−0.3 are shown as edges. A: Darkseagreen associated with glucose incorporation into BAT lipids. Hiat1 (yellow circle), hippocampus abundant transcript 1, is the hub gene, and it is negatively correlated with glucose incorporation into BAT lipids. B: Coral4.1 associated with relative mass of BAT. Sema3a (yellow circle), semaphorin 3A, is the hub gene, and it is positively correlated with BAT relative mass.

