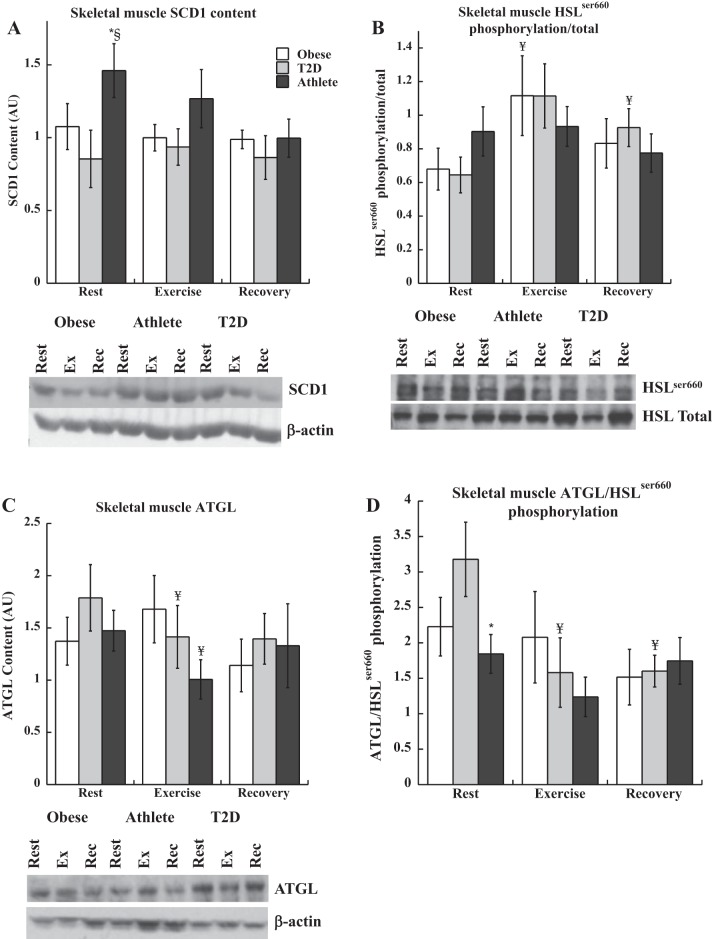
Fig. 5.
Skeletal muscle protein content and phosphorylation for SCD1 (A), HSLser660 phosphorylation (B), ATGL (C), and ATGL/HSLser660 phosphorylation (D) during rest, exercise, and recovery in obese volunteers, individuals with type 2 diabetes, and endurance-trained athletes. *Significantly different from T2D, P < 0.05, §significantly different from obese, P < 0.05, ¥significantly different from rest, P < 0.05. Values are means ± SE.

