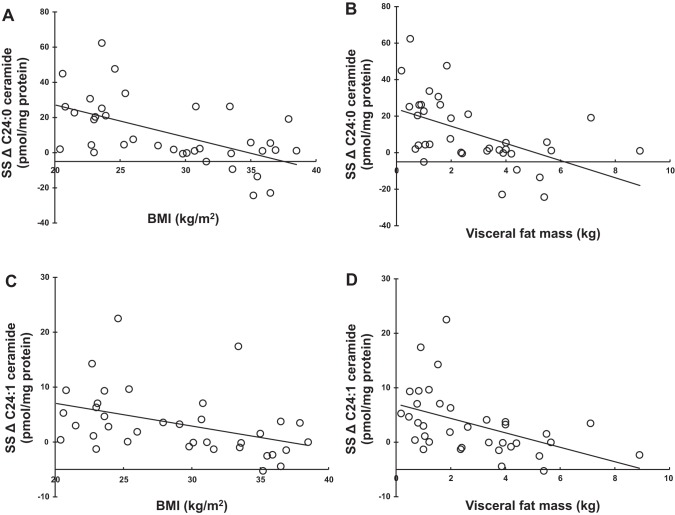
Fig. 3.
Relationships between metabolic parameters and the postprandial changes of intramyocellular very-long-chain ceramide species concentrations. A: correlation between body mass index (BMI) and the change in SS C24:0 ceramide concentration (ρ = –0.439, P = 0.0065). B: correlation between visceral fat mass and the change in SS C24:0 ceramide concentration (ρ = –0.543, P = 0.0005). C: correlation between BMI and the change in SS C24:1 ceramide concentration (ρ = –0.461, P = 0.0041). D: correlation between visceral fat mass and the change in SS C24:1 ceramide concentration (ρ = –0.545, P = 0.0005). ρ represents the Spearman’s rank correlation coefficient. Intramyocellular ceramide concentrations are normalized to per milligram of protein. The change (Δ) in intramyocellular ceramide concentrations was calculated as the data from the second biopsy minus that from the first biopsy.

