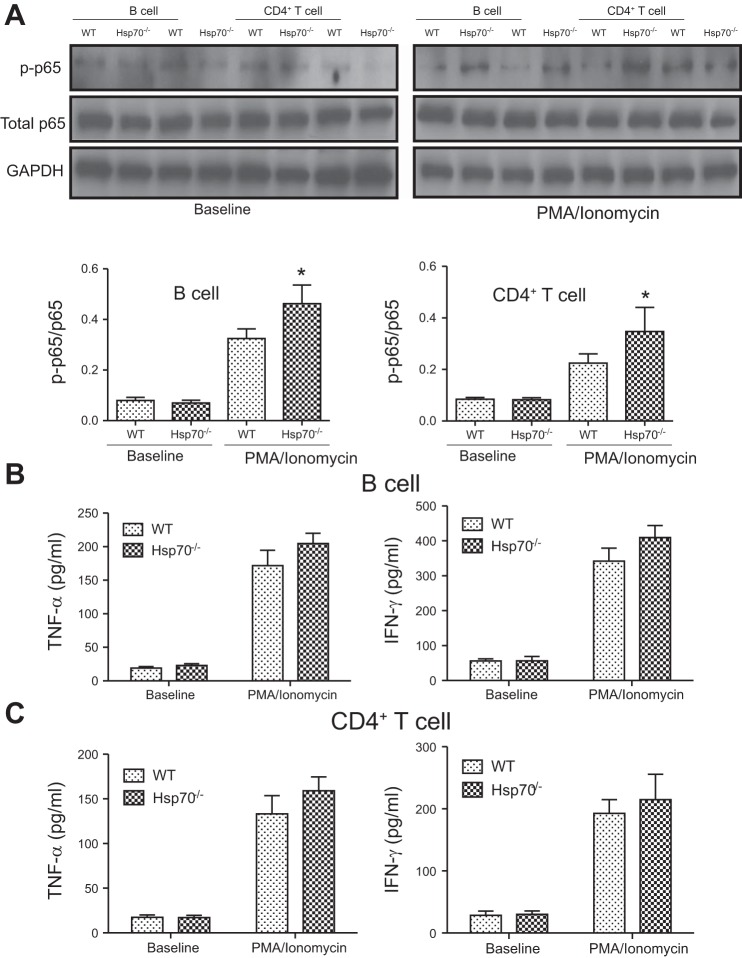
Fig. 8.
NF-κB phosphorylation and expression of proinflammatory cytokines in B and T cells. A: NF-κB phosphorylation status in B and CD4+ T cells at baseline and after stimulation was examined by comparing p65 phosphorylation. Densitometry measurements showed NF-κB phosphorylation was significantly increased in cells collected from Hsp70−/− mice compared with that in WT cells after stimulation. B: TNFα and IFNγ expression in B cells at baseline and after stimulation. No significant difference was detected between Hsp70−/− and WT. C: TNFα and IFNγ expression in CD4+ T cells at baseline and after stimulation. No significant difference was detected between Hsp70−/− and WT. Bars represent means ± SD. Data were analyzed by Student’s t-tests. *P < 0.05.

