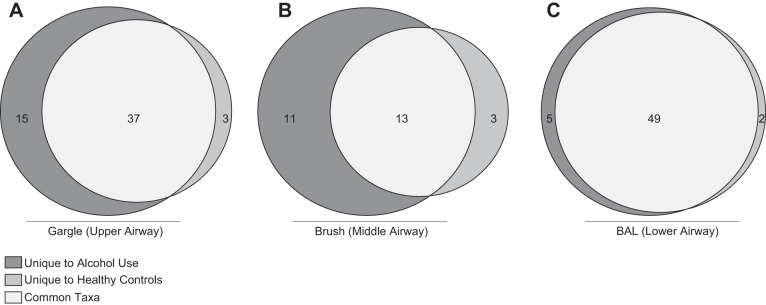
Fig. 5.
Core microbiome of controls and AUD cohorts at each distinct sampling site. Core taxa present in 100% of subjects within a cohort were compared. Taxa in light gray were found in the full cohort of samples, taxa in dark gray were only found in AUD subject samples, and taxa in gray were only found in healthy control samples. Taxa found in each section are shown in Supplemental Table S1.

