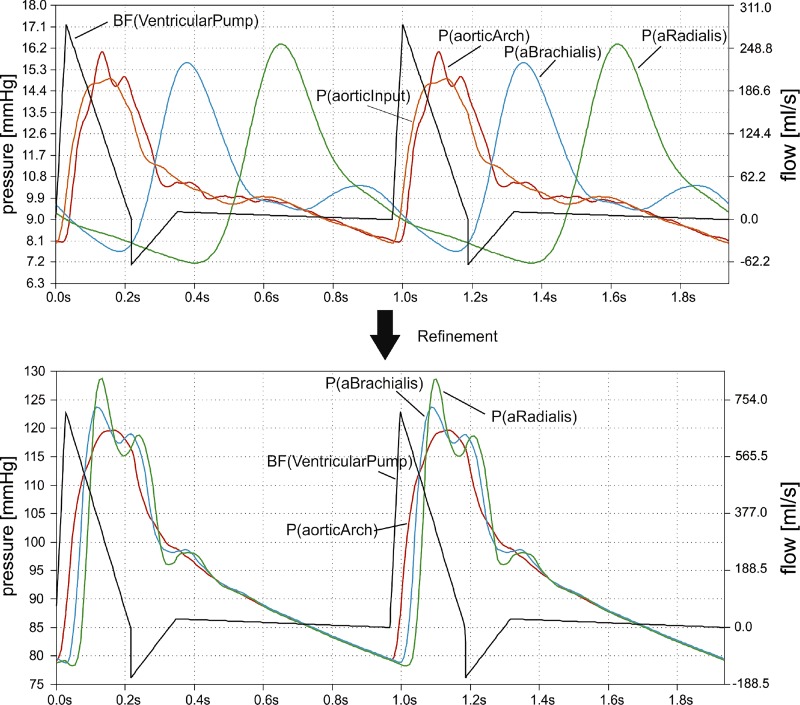
Fig. 3.
Blood flow and pressures in the original and refined Westerhof model. Top: ventricular pump output flow (black) and pressures between aortic input (orange) and radial (green) artery in the original Westerhof model (software reproduction). Bottom: pulse wave travel from aortic arch (red) to a. radialis (green) in the refined Westerhof model. P(aorticInput) is omitted in the refinement diagram as it is nearly identical to P(aorticArch) and interferes graphically. In both diagrams, currents and voltages are translated to blood flow [BF (in milliliters per second) on right y-axis, uncalibrated] and pressures [P (in millimeters of mercury) on left y-axis] for better understanding.

