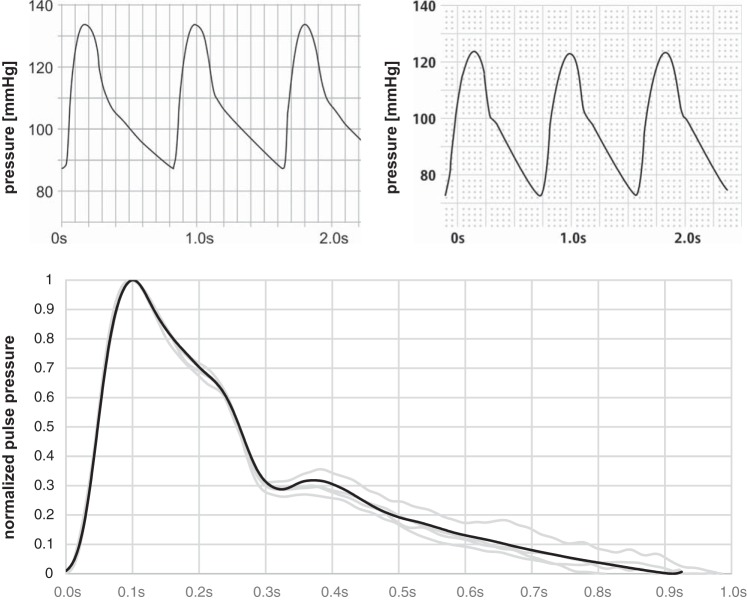
Fig. 6.
Proof of concept. Top: comparison of estimated (left) and invasively measured (right) central pulse curves. There was error of 6% between estimated and measured (aortic root) central systolic blood pressure and an 18% error for central diastolic blood pressure, respectively. Bottom: software simulation showing an excellent model quality (Pearson correlation between mean of measured data set and simulated data set is 99.8%) of the measured radial (gray) and the estimated radial (black) curves. The following parameters were used: cMult = 0.45, lMult = 1.9, and dMult = 29.8. Waveforms were normalized to facilitate comparison setting diastolic minima to the absolute value 0 and systolic maxima to 1.

