Fig. 4.
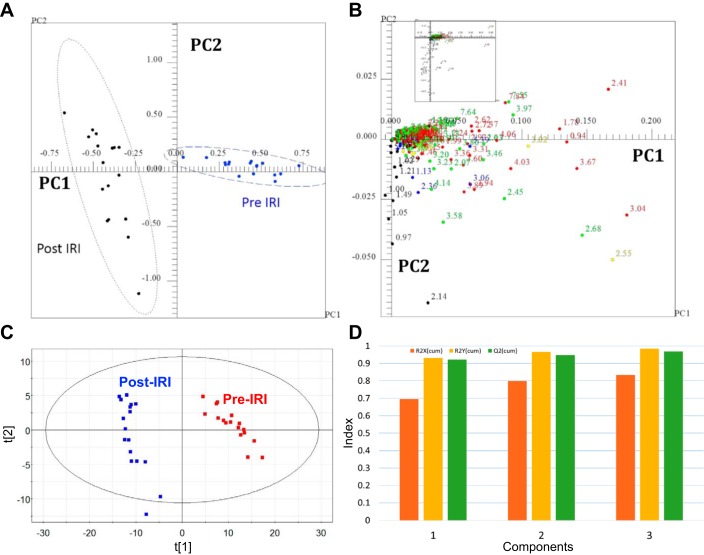
Two-dimensional principal component analysis (PCA) scores and loadings plots for comparison of urine samples from post-IRI mice and control mice. A: PCA scores plot for comparison of urines from control mice and IRI mice. Each point in the scores plot represents the NMR spectrum of a mouse projected onto the 2-dimensional space defined by the 1st 2 principal components. B: the loadings plot corresponding to the scores plot shown in A. The buckets (points) in the loadings plot are color-coded according to bucket P value: P > 0.00027027 (black); zone 1: 1e-005–2.7e-004 (blue); zone 2: 1e-007–1e-005 (green); zone 3: 1e-009–1e-007 (yellow); and zone 4: 1e-020–1e-009 (red). The Bonferroni corrected α-value was 2.7e-004. 163 of 186 resonances were significant by α = 0.05 with 145 of those resonances being significant by the Bonferroni corrected α-value of 2.7E-4. Twenty-three metabolites were significantly different in urine following IRI. C: PLS-DA scores plot for comparison of urines from control mice (Pre) and IRI mice (Post). D: graph of the cumulative R2X, R2Y, and Q2 values obtained from cross validation of the data using repeated calculations withholding 1/7 of the data.

