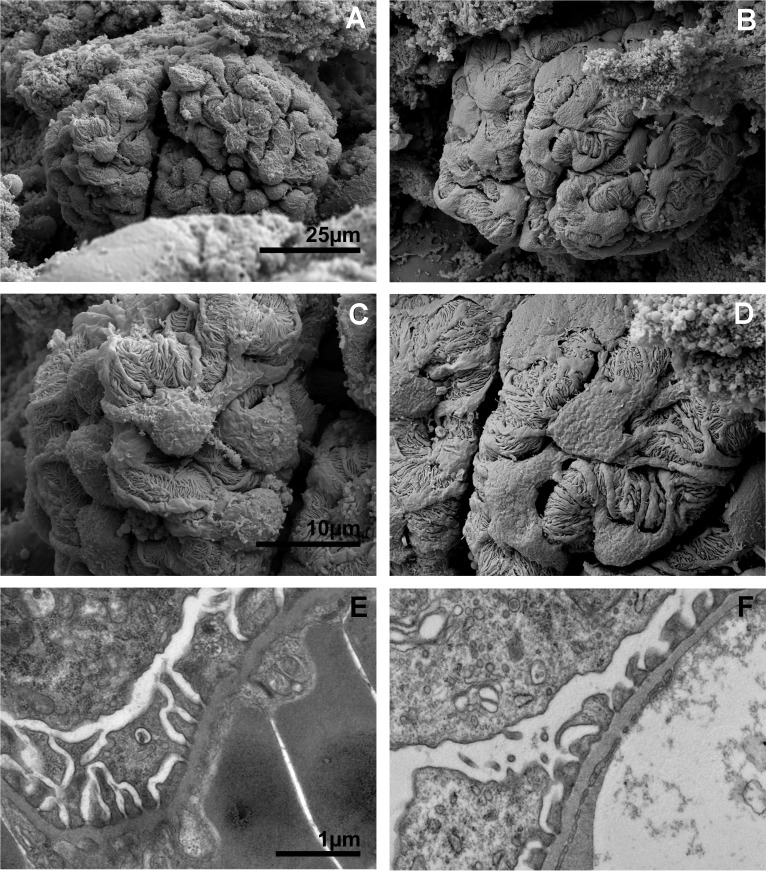
Fig. 5.
Electron microscopy images of glomeruli from control and IRI mice. Scanning electron microscopy (SEM) of a control glomerulus (A) and an IRI glomerulus (B) at low magnification. C: high-magnification SEM of the surface of a control glomerulus showing the complex interdigitations of podocytes and their foot processes. D: high-magnification SEM of an IRI glomerulus podocyte foot process effacement following injury. E: transmission electron microscopy (TEM) of a control glomerulus podocyte foot processes. F: TEM of IRI glomerulus podocyte foot processes. A and B, C and D, and E and F were captured at the same magnifications.

