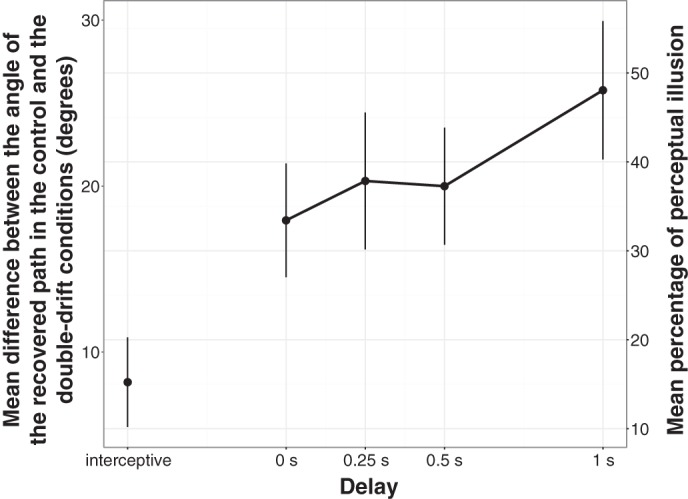
Fig. 4.

Mean difference between the angle of the recovered path in the control and the double-drift conditions as a function of the delay. The right y-axis shows the result as a percentage of the angular difference between the perceived path and the physical path. A full perceptual illusion would correspond to an average deviation between the 2 paths of 52°. Error bars represent SE.
