Fig. 4.
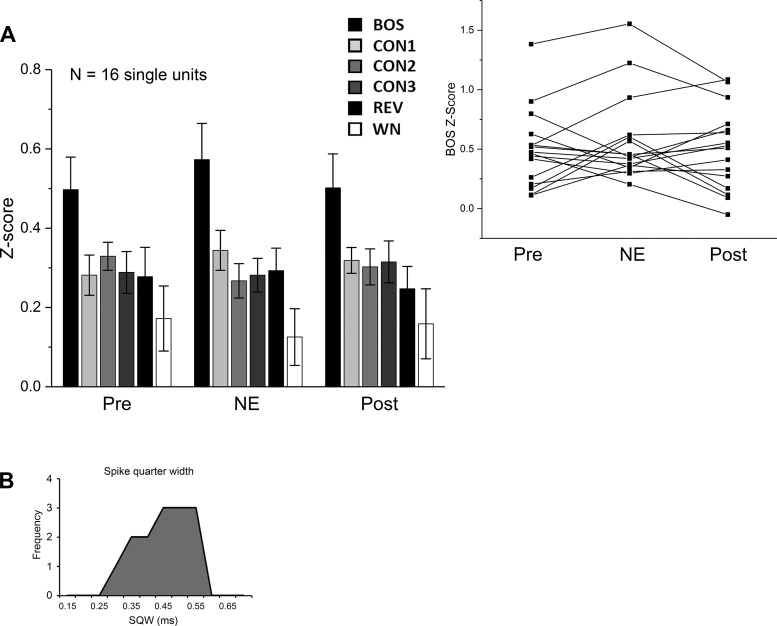
NE treatment in NCM does not alter auditory-evoked responses or selectivity in HVC. A: z-score data are means ± SE; n = 16 cells. Inset: individual trajectory plots show responses to BOS for each single unit. B: neurons in HVC show a unimodal distribution for spike quarter width (SQW) measurements.

