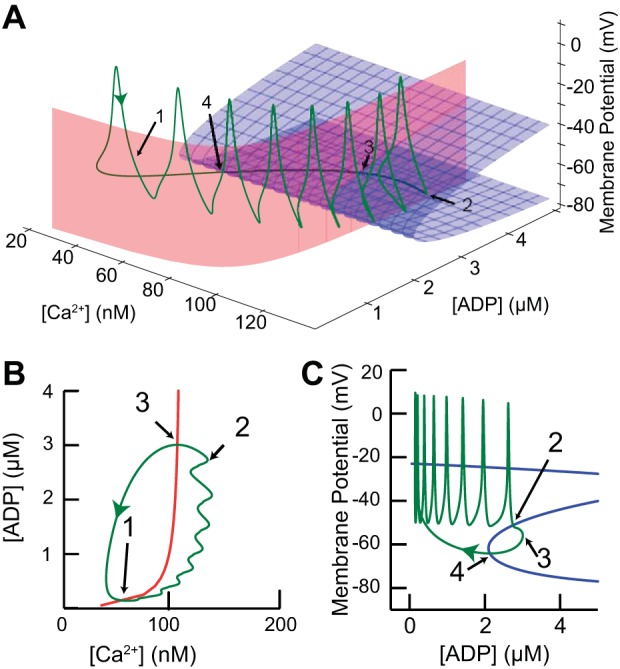
Fig. 6.

Phase space analysis explains the bursting mechanism. A: green curve represents a single cycle of the periodic bursting activity in Fig. 5B plotted in the state space. Blue surface comprises the lower 2 branches of the voltage nullcline (dV/dt = 0) in the V/ADP plane (all 3 branches are shown in C). Red surface is the ADP nullcline (dADP/dt = 0) in the ADP/Ca2+ plane (shown as red curve in B). The trajectory crosses the ADP nullcline at points 1 and 3 and the voltage nullcline at points 2 and 4. B: projection of ADP nullcline from A onto the ADP/Ca2+ plane. C: projection of V nullcline from A onto the V/ADP plane. In this view it is clear that the burst is terminated when the trajectory hits the middle branch of the voltage nullcline (dV/dt = 0, blue), then slowly repolarizes after exiting through the “knee.” Part of the Z is not visible on this scale, but the curve is continuous.
