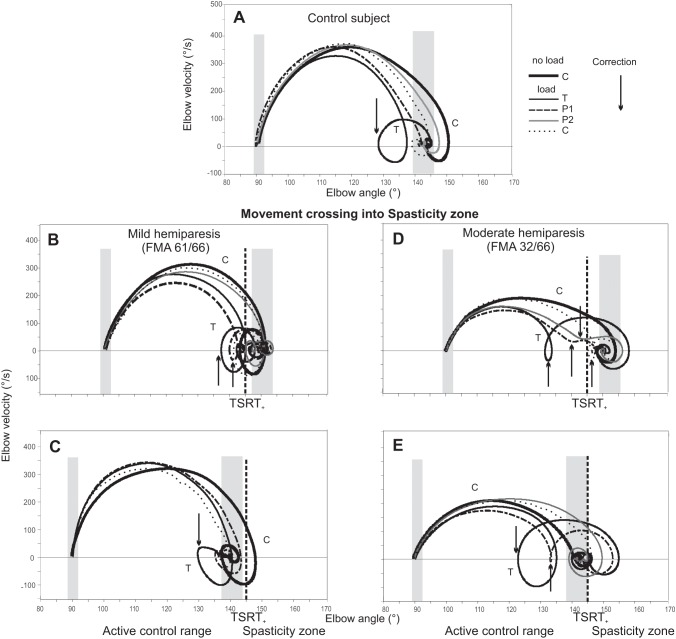
Fig. 6.
Representative phase (velocity vs. angle) diagrams for 1 block of trials in which the no-load condition suddenly changed to the load condition in a control subject (A) and in subjects with mild (B, C) and moderate (D, E) upper limb hemiparesis when the movements ended in the spasticity zone (B, D) or were restricted to the active control range (C, E). The left and right vertical bars indicate the initial (3°) and final (6°) targets, respectively. The vertical dashed line indicates the position of the TSRT located within (B, D) or beyond (C, E) the active control range. C (thick curve) is the last trial in a block of trials in the no-load condition. T, P1, P2, and C (dashed curve) are sequential trajectories in the subsequent block of trials in the load condition. Inflection points indicating corrective movements are marked by vertical arrows.

