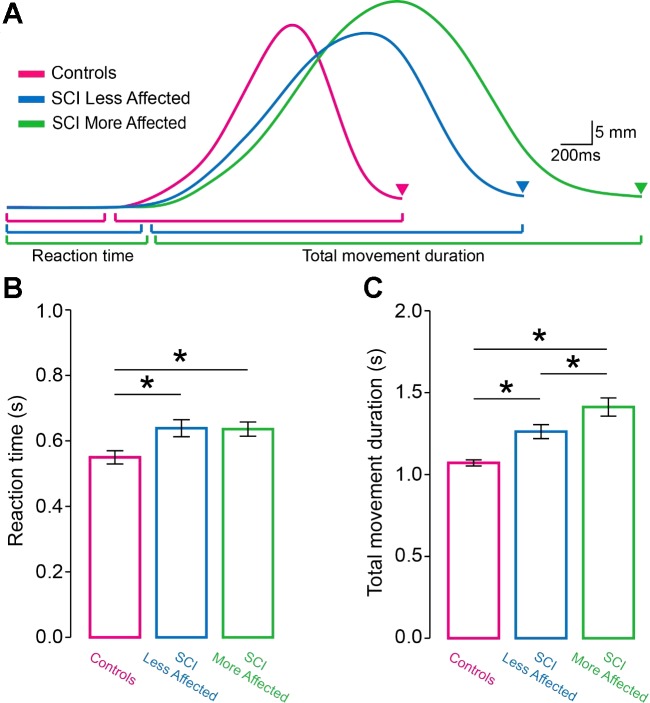
Fig. 2.
Reaction time and total movement duration. A: raw traces showing hand aperture size of the dominant arm of controls (purple trace), and in the less affected (blue trace) and more affected (green trace) arm of spinal cord injury (SCI) participants during reach-to-grasp movements. Triangles indicate the time at which both the index finger and thumb contacted the object. Graphs show the group data (controls, n = 20 and SCI, n = 20). The abscissa shows all groups tested [controls (purple bar), SCI less affected arm (blue bar), and SCI more affected arm (green bar)]. The ordinate shows the reaction time (B) and total movement duration (C) expressed in seconds (s). Note that reaction time was shorter in controls compared with both arms of SCI participant. Also, note that the total movement duration was more prolonged in the more affected arm of SCI participants compared with controls and the less affected arm. Error bars indicate SEs. *P < 0.05.

