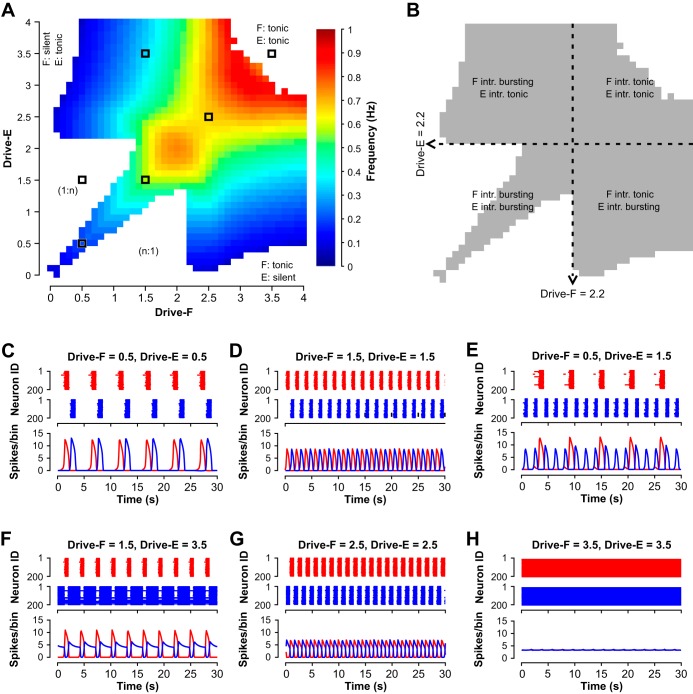
Fig. 5.
Activity regimes depend on drive to half-center populations in the population model. A: frequency heat map obtained by independently varying flexor and extensor drives. Only frequencies where the flexor and extensor are bursting in strict alternation (1:1) are color coded. White areas are indicated where nonphysiological bursting occurs (1:n) (example with n = 3 shown in E) and where the flexor and/or extensor are tonic or silent (example for both tonic shown in H). B: alternating bursting (1:1) results from a wide range of drive combinations and underlying intrinsic (intr.) activity regimes of the flexor and extensor populations. Dashed lines indicate where the intrinsic activity state switches from bursting to sustained activity. C–H: examples of raster plots and histograms of flexor (red) and extensor (blue) population activities corresponding to different regimes of model activity. C: bursting activity of both half-centers with a gap between two bursts occurring at low, symmetric drives (Drive < 1.4). D: alternating bursting at intermediate, symmetric drives, when both half-centers operate in their intrinsic bursting mode. E: nonphysiological (1:n) bursting. F: oscillations based on intrinsic bursting of the flexor half-center with the extensor half-center exhibiting sustained activity if isolated. G: classical half-center oscillations, where both half-centers if isolated are in a sustained activity-mode. H: tonic activity that emerges at high symmetric drive.

