
Fig. 8.
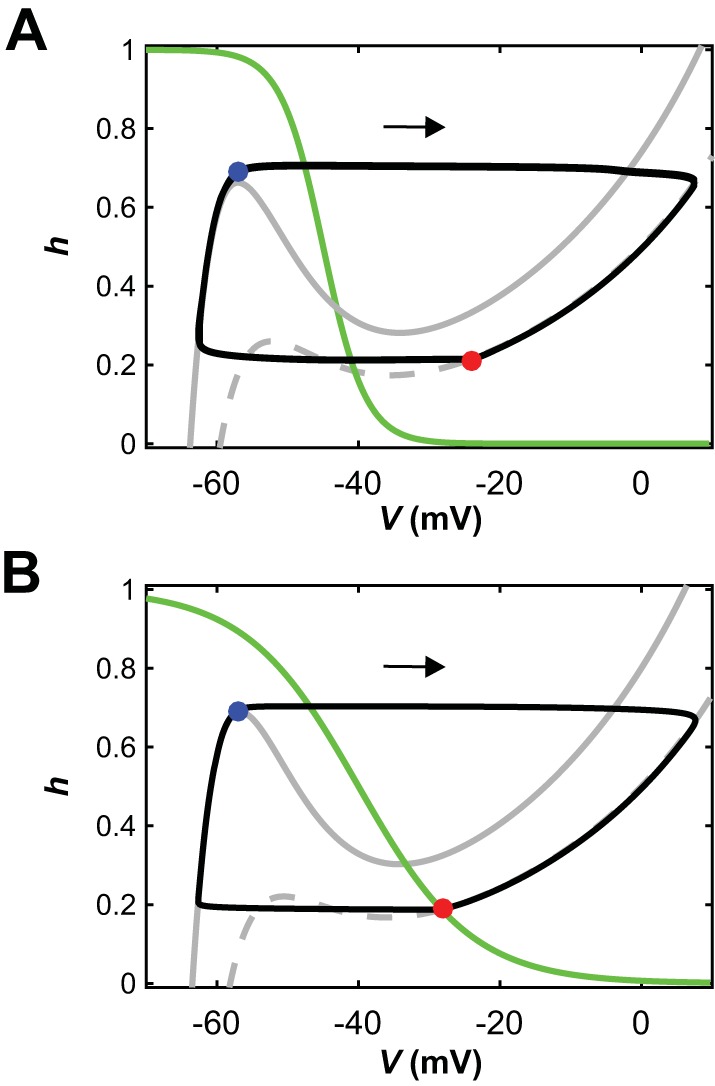
Escape transitions can occur when units are intrinsically oscillatory or tonic. A and B: with symmetric drives to both reduced model units, their nullclines and trajectories look identical in the phase plane, so we use a single phase plane diagram for both units (e.g., Rubin and Terman 2002). As in Fig. 3, gray curves are V-nullclines (solid, maximal inhibition; dashed, no inhibition), green are h-nullclines, and black are trajectories, which evolve clockwise (arrows). A: diagram when both units are intrinsically oscillatory. When one unit reaches the left knee of the maximal-inhibition V-nullcline, it initiates a phase transition by escaping from the silent phase (blue circle). The other unit becomes inhibited and jumps down to the silent phase (red circle). Although there is no fixed point in the active phase (right branch of V-nullclines), the transition is by escape rather than by release. B: when there is a fixed point in the active phase (red circle), transitions must occur by escape, which happens when a silent unit reaches the left knee of the maximal-inhibition V-nullcline (blue circle).