Fig. 9.
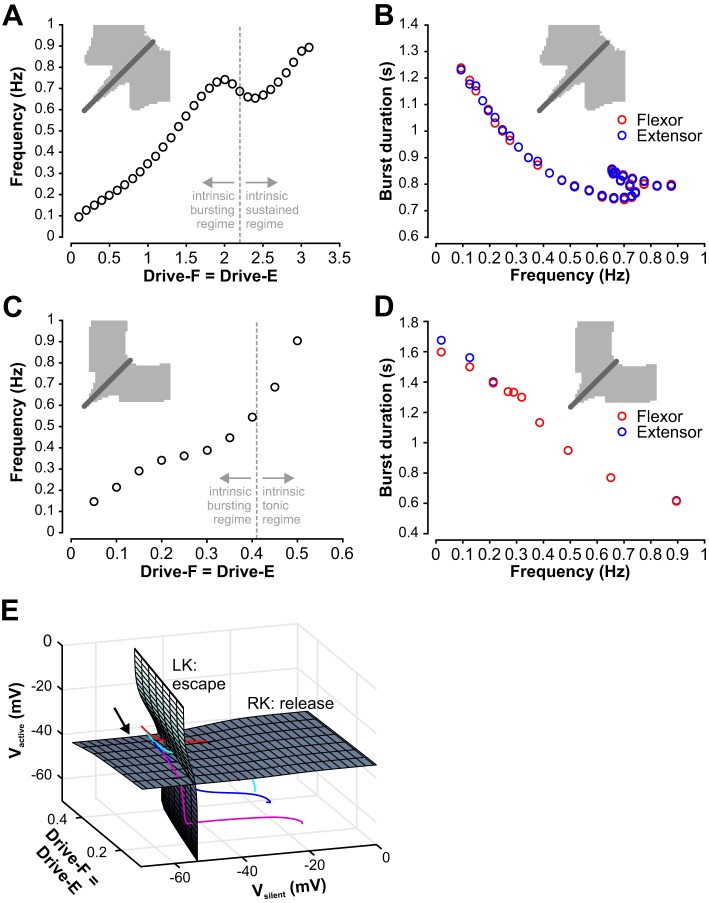
Control of frequency and burst durations with symmetric (equal) drives to both half-centers. A: for the population model, frequency increases with increasing drive but exhibits a drop at Drive-F = Drive-E≈2 that is followed by a subsequent increase in frequency when drive increases even more. The dashed line indicates the transition from the intrinsic bursting to the intrinsic sustained regime, which does not correspond to changes in the slope of the curve. B: flexor and extensor burst durations are equal over the whole frequency range for the population model. C: for the reduced model, frequency also increased with drive, over a similar range as for the population model. In an intermediate drive range the increase slowed, but no decline in frequency was observed. The dashed line indicates the transition from the intrinsic bursting to the intrinsic tonic regime, which does not correspond to changes in the slope of the curve. D: flexor and extensor burst durations are at least approximately equal over the whole frequency range for the original reduced model. E: knee surfaces derived from voltage nullclines for the reduced model. If the drive level to both units and the voltage level of one unit are fixed, then the other unit has a voltage nullcline (see methods, Fig. 2) with turning points at left (low V, high h) and right (high V, low h) knees. When the drive level or the voltage level of the fixed unit is varied, the nullcline and its knees move accordingly; see methods, Eqs. 7, 9, and 10. Gray surfaces are surfaces of left (LK) and right (RK) knees parameterized by drive level and by voltage of the fixed unit. Since the left knee surface is relevant when a unit is silent and the other unit is active, it is represented as a function of drive and the voltage level of the active unit (Vactive). Since the right knee surface is relevant when a unit is active and the other unit is silent, it is represented as a function of drive and the voltage level of the silent unit (Vsilent). Colored curves are trajectories of the coupled models for Drive-F = Drive-E = 0.15 (magenta), 0.25 (blue), 0.3 (cyan), 0.35 (red), each shown near a transition when one unit activates and the other falls silent. These evolve from upper left to lower right (arrow). In a transition by escape, a trajectory intersects the LK surface before the RK surface (red, cyan curves). This order is reversed in a transition by release (blue, magenta curves).

