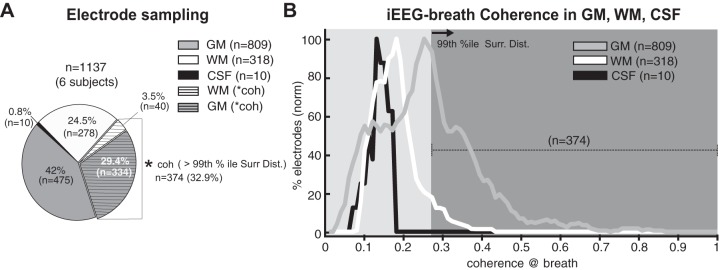
Fig. 3.
A: iEEG-breath coherence in gray matter (GM), white matter (WM), and cerebrospinal fluid (CSF). Pie chart shows the total number of electrodes (n = 1,137 in 6 subjects) and the electrodes that showed iEEG-breath coherence greater than 99th percentile of the surrogate distribution derived from shifting the respiration signal with respect to the iEEG [asterisk indicates coherence >99% percentile; n = 374 (32.9%), horizontal hatching]. Most of the electrodes with greater coherence were in gray matter. B: distribution of coherence values at the respiratory rate across the population of GM, WM, and CSF electrodes as a percentage of the total of each. Coherence values were larger in most electrodes located in the GM than those in WM and CSF. Values (y-axis) were smoothed (0.02 window width) before being plotted and are normalized (norm) for each area (GM, WM, or CSF) separately. Dark gray area shows coherence greater than 99th percentile (n = 374). GM sites show a bimodal distribution, with one population showing higher local mode at 0.25 and the other at a mode close to that of the WM and CSF at 0.12. coh, Coherence value; 99% ile Surr Dist., >99th percentile of the surrogate distribution.

