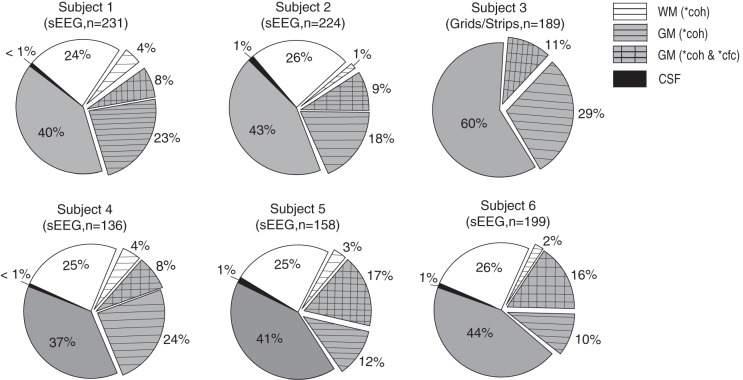
Fig. 6.
Electrode sampling and effects in 6 individual subjects (n = total number of electrodes analyzed in each subject after electrodes were removed from the SOZ). Subject 3 was implanted with grids and strips and consequently had no electrodes in the WM or the CSF. The remaining subjects were implanted with depth (sEEG) electrodes. Each sEEG subject had electrodes implanted in the WM and the CSF. Pie charts show the percentage of electrodes with high iEEG-breath coherence (horizontal hatching; >99th percentile of surrogate distribution) and the percentage of electrodes with high iEEG-breath coherence as well as phase-gamma amplitude coupling (cross-hatching; >99th percentile). Only 2 electrodes showed high phase-amplitude coupling and low coherence (1 electrode in each of subjects 1 and 2; data not shown). coh, iEEG-breath coherence; cfc, cross-frequency coupling of iEEG-gamma amplitude to respiration phase. Asterisk indicates >99th percentile of the surrogate distribution.

