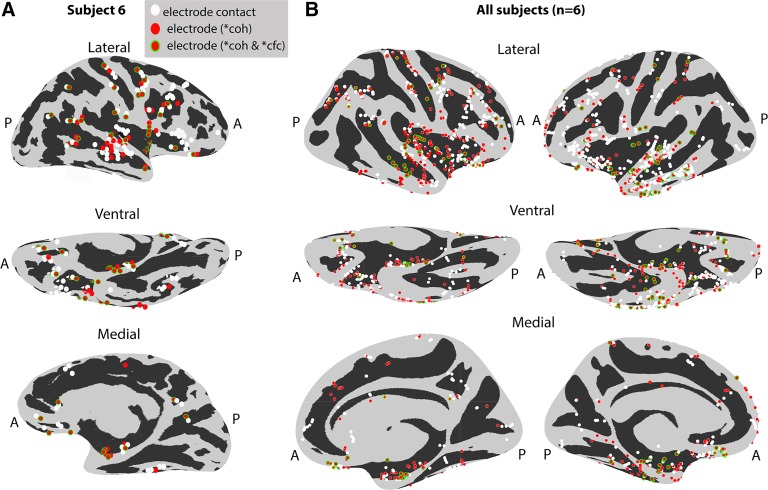
Fig. 7.
Coherence and cross-frequency coupling effects localized on inflated brain surfaces. A: representative subject’s inflated brain. Electrodes with high coherence (red) as well as cross-frequency coupling (red with green outline) are displayed in 3 different brain views (lateral, ventral, and medial). Other electrodes (white) had values below the 99th percentile threshold. B: electrodes from 6 subjects registered onto a common brain surface (see materials and methods). Electrodes with high coherence and cross-frequency coupling are broadly distributed across multiple brain areas. A, anterior; P, posterior. Asterisk indicates >99th percentile of the surrogate distribution.

