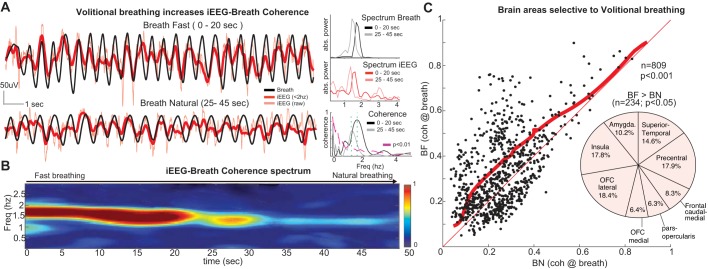
Fig. 8.
Volitional breathing increases iEEG-breath coherence and recruits frontal networks. A, left: raw iEEG (red) and manometric respiration signals (black) from a sample electrode in the caudal medial frontal cortex during fast breathing (top; 0–20 s) followed by the transition to natural breathing (bottom; 25–45 s). Note the larger amplitude and faster frequency in both iEEG and breathing signals during the initial hyperventilation period, as well as the stronger iEEG-breath phase locking. Right, plots show the power spectrum peaks at 1.7 Hz during hyperventilation and at 1.4 Hz during transition to natural breathing for the respiration signal (top; black lines) and the iEEG signals (middle; red lines), as well as the iEEG-breath coherence (bottom). The coherence peak at the breathing rate (green dashed lines) is smaller when the subject breathes more slowly (gray line). B: time-frequency coherence spectrum between the signals shown in A. The peak in the spectrum closely follows the respiration rate. C: iEEG-breath coherence at the respiration rate for all electrodes in the gray matter (n = 809) during fast breathing (BF; vertical axis) and natural breathing (BN; horizontal axis). Coherence values were significantly increased across the population during fast breathing (P < 0.001, Wilcoxon signed-rank test). Thick red line shows the significance threshold (P < 0.05, bootstrapping method, 95% percentile) with 234/809 electrodes above the line showing significantly increased coherence values. Thin red line represents unity. Pie chart shows the locations of those 234 electrodes within the gray matter where coherence was significantly larger during fast breathing vs. natural breathing. Note the large proportion of electrodes in frontal areas, including caudal medial frontal cortex. Freq, frequency; OFC, orbitofrontal cortex.

