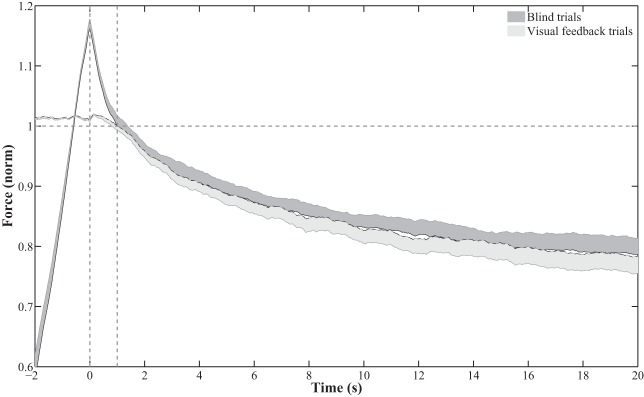
Fig. 3.
Total force (FTOT) produced by a hand under conditions without visual feedback (“blind trials”; solid line with dark shading) and with visual feedback presented over the first few seconds of the trial (“visual feedback trials”; dashed line with light shading). Time 0 shows the time when the subject was asked to stop increasing force in the blind trials and when the visual feedback was turned off in the trials with visual feedback. Mean data across subjects are shown with SE half-shading. FTOT was normalized by the force value observed 1 s after time 0. The task force is indicated by the horizontal dashed line. Analysis was performed starting 1 s after time 0 (second vertical dashed line).

