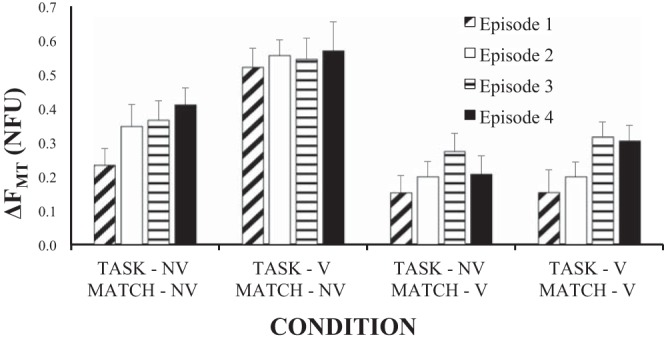
Fig. 7.

Difference between the forces produced by the match hand and by the task hand (ΔFMT) during the 4 episodes under the 4 vibration conditions. Mean data across subjects are shown with SE bars. Note the increase in ΔFMT from episode 1 to episode 4, the larger values when only the task hand was vibrated (second cluster of bars), and the smaller values when only the match hand was vibrated (third cluster of bars). V, vibration; NV, no vibration.
