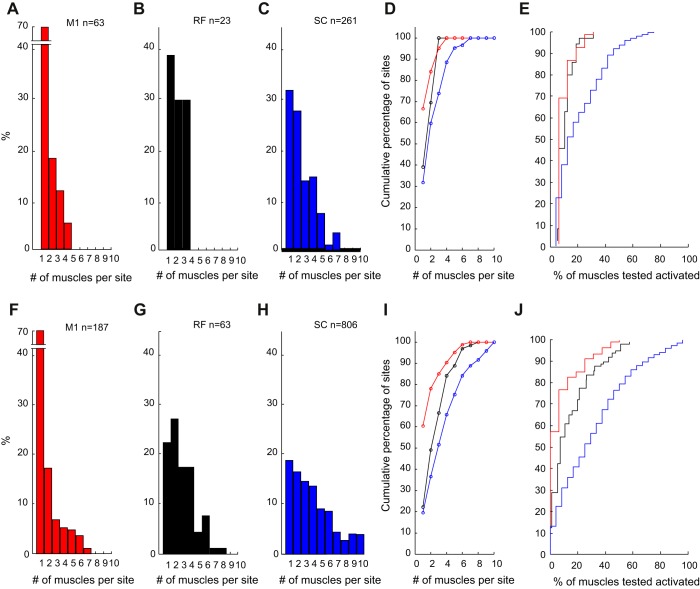
Fig. 3.
Distribution of number of muscles activated per site, using a reduced set of 10 muscles for each area, and only sites activated at threshold intensity A: M1. B: RF. C: SC. D: same data as A–C, but replotted as a cumulative distribution to allow comparison of the different areas. Line colors correspond to the colors used in A–C. E: similar plot as D, but now using all muscles recorded in a given animal; abscissa is expressed as a percentage of the number of muscles available for analysis in each case. F–J: similar display as A–E, but now using all responses recorded, rather than just those at threshold.

