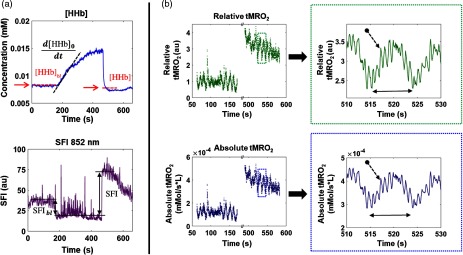
Fig. 5.
Metabolic calculation. Panel (a) contains the cSFDI parameters used to calculate absolute and relative tissue metabolic rates of oxygen consumption (). The top plot in panel (a) shows deoxyhemoglobin concentration and the bottom plot shows SFI at 852 nm throughout the arterial occlusion protocol. Panel (b) contains relative and absolute . The two plots in green along the top contain relative metabolism and the two plots along the bottom contain absolute metabolism. The plots on the left contain the baseline and postocclusion time-series data and are separated by a break in the -axis. The plots on the right of panel (b) contain an expanded view of a 20 s period (510 to 530 s) obtained from the dotted rectangles in the plots on the left.

