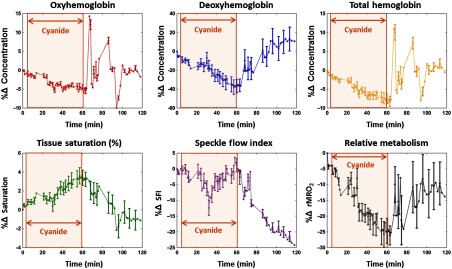
Fig. 7.
Rabbit cyanide cSFDI experimental results. Along the top from left to right, the plots contain the percent change from baseline in tissue concentrations of deoxyhemoglobin, oxyhemoglobin, and total hemoglobin, respectively. Along the bottom from left to right, the plots contain percent change in tissue saturation, SFI, and relative tissue metabolic rate of oxygen consumption ().

