Fig. 5.

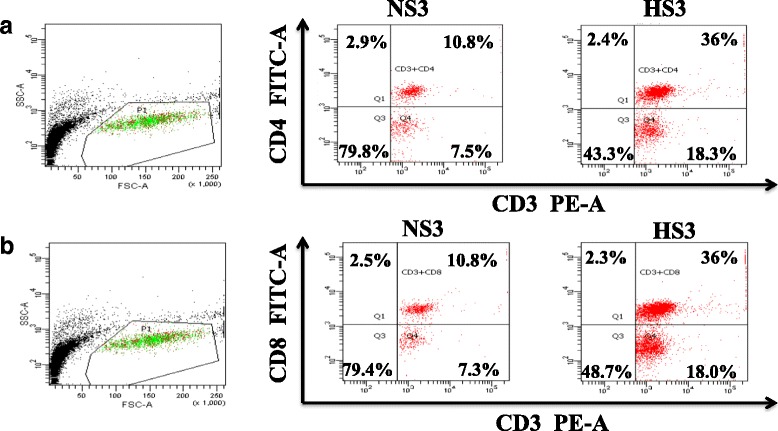
Flow cytometric analysis T cells in peripheral circulation. a CD4+ T cell (CD3+CD4+). b CD8+ T cell (CD3+CD8+). Data is represented as the percentage of CD3+CD4+, CD3+CD8+

Flow cytometric analysis T cells in peripheral circulation. a CD4+ T cell (CD3+CD4+). b CD8+ T cell (CD3+CD8+). Data is represented as the percentage of CD3+CD4+, CD3+CD8+