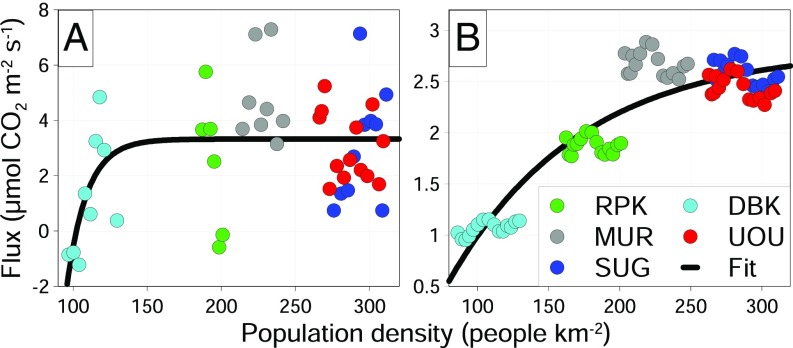
Fig. 4.
Summer daytime fossil fuel CO2 fluxes calculated from the observations (A) and from the FFDAS inventory (B) at each of the sites as a function of population density. Each point represents the summertime average flux from a specific year, with the flux calculation described in the text and SI Appendix. The black curve is an exponential function fit to the data.

