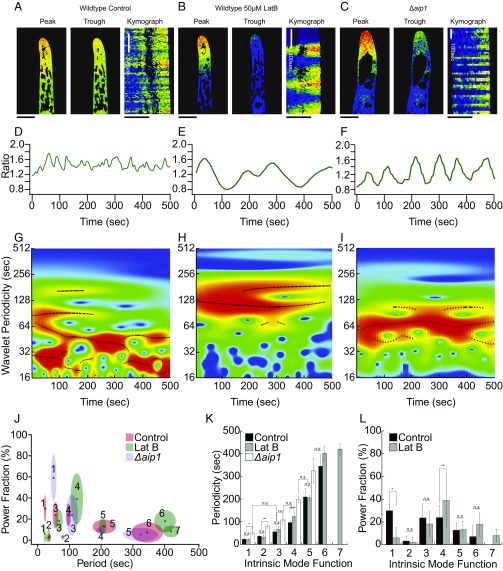
Fig. 2.
Visualization of tipward calcium gradient in protonemata. Representative images from a time-lapse acquisition showing the peak and trough of the calcium fluctuations in WT (A), 50 μM LatB-treated WT (B), and Δaip1 (C) cells (Movie S1). (Scale bars, 10 μm.) Kymographs are made from a 20-μm line drawn through the middle of the cell, parallel to the access of growth. Line traces of mean intensity in an apical region ROI for WT (D), LatB-treated WT (E), and Δaip1 (F) cells. Wavelet analysis output represented as a heat map, from WT (G), LatB-treated WT (H), and Δaip1 (I) cells. Black lines are ridges of statistically significant oscillations. (J) Period–power fraction plot of IMFs in each treatment. Size of ellipse is SD on each axis. (K) Period plot of each IMF. Stars denote statistical difference (Fisher’s LSD, P < 0.05). (L) Power fraction plot for each IMF in control and LatB-treated cells. Power of the IMFs shifts to favor longer periods, specifically IMF4 (Fisher’s LSD, P < 0.05).

