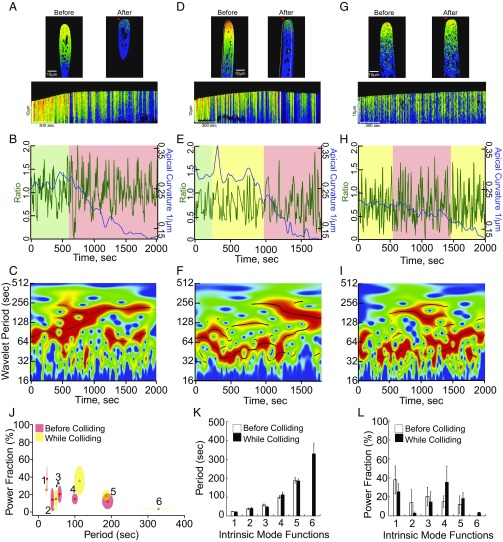
Fig. 3.
The tipward calcium oscillations were altered by inhibiting growth mechanically. (A, D, and G) Representative images and kymographs from a time-lapse acquisition of cells interacting with barriers. Deformed tips denoted by red arrows. White outline marks the cell’s initial position before it translocated along the barrier. (B, E, and H) YCN ratio trace (green line) and apical curvature (blue line); note that apical curvature decreases as a function of tip deformation. Green denotes time period before collision, yellow denotes time period when cell exhibits intermediate expansion rates, and red denotes time period when cell exhibits minimal expansion rates. (C, F, and I) Wavelet analysis showing a shift to favor long periods after maximal decrease in expansion rate (Fig. S3). (J) Period–power fraction plot of IMFs obtained from the green/yellow regions of traces before the maximal collision state (red regions). Size of ellipse denotes SD on each axis. (K) Period of each IMF before and during impact, showing that period length is unaffected. (L) Power fraction of each IMF shows a trend to favor IMF4 upon impact.

