Fig. 4.
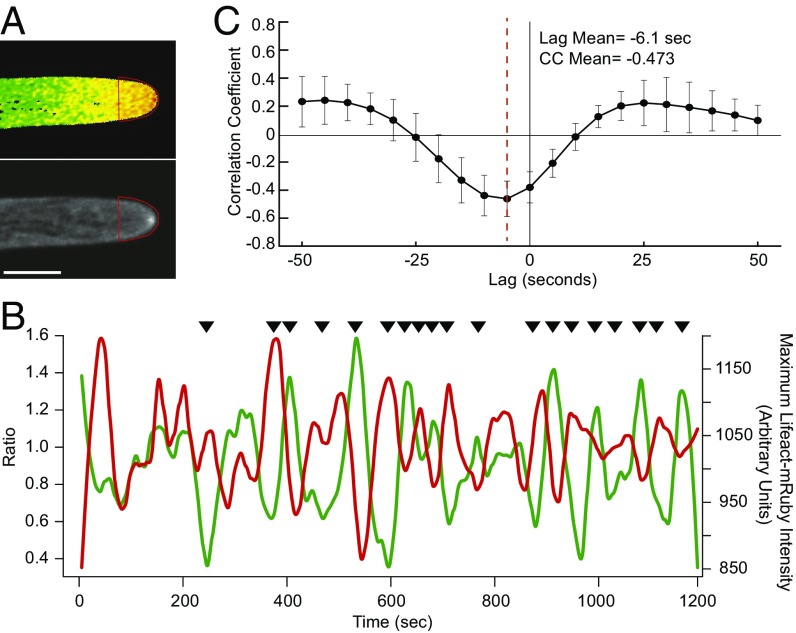
Actin and calcium are anticorrelated at the tip of growing cells. (A) Images of YCN and Lifeact-mRuby acquired simultaneously. Red trace depicts the ROI used for analysis (Movie S3). (Scale bar, 10 μm.) (B) Intensity plot of mean YCN intensity within the ROI (green) and maximum Lifeact-mRuby intensity within the ROI (red). Black arrows indicate qualitative regions of anticorrelation. (C) Cross-correlation average trace (n = 9 cells) revealing a maximum correlation coefficient and lag between calcium and actin.

